- E-mail info@bulwarks.net
- Location Jal el Dib, Lebanon
OpManager
What is OpManager?
Why OpManager?
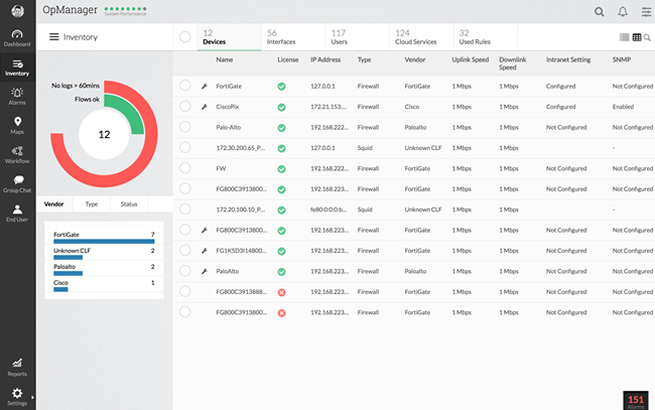
OpManager, the trusted network monitoring software
OpManager continuously monitors the network and provides an in-depth visibility and control over it. In case of a fault, you can easily drill down to the root cause and eliminate it before operations are affected.
OpManager also provides integrated troubleshooting capabilities with planning and configuration management.
Network monitoring on the go

Real-time network monitoring
With over 2000 built-in network performance monitors, monitor health and critical metrics such as packet loss, latency, speed, errors and discards, and analyze performance bottlenecks.

Physical and virtual server monitoring
Monitor CPU, memory, and disk utilization of Windows and Linux servers. Also monitor the performance of Host and VMs of VMware, Hyper-V and Xen virtualization platforms.

Multi-level thresholds
Proactively monitor network performance with multi-level thresholds. For every critical performance monitor, set multiple thresholds and get instant alerts for violation.

Customizable dashboards
Assess default dashboards or create your own dashboards by making use of over 200 performance widgets available and view performance of your network at-a-glance.

WAN Link monitoring
Monitor key metrics such as latency, jitter, RTT, and packet loss to eliminate network issues. View hop-by-hop performance to find what’s causing latency and fix it quickly.

Affordable and easy to set up
ManageEngine OpManager requires no costly consultation or training for installation and user education. It’s the only network monitor tool to offer a transparent device-based pricing mode